Viewing the Anticoagulation Summary Sheet
View video tutorial: INR management: Adjusting anti-coagulant dosage
If an active medication is flagged as an anticoagulant, an Anticoagulation Summary Sheet (or INR Summary Sheet) is created. This summary provides an overview of a patient’s INR results and adjustments as well as patient instructions and a callback log.
The easiest way to monitor a patient’s INR progress over time is to graph their INR results. From the Anticoagulation Summary Sheet, you can graph a patient’s INR results and superimpose their anticoagulation medication dosage. You can also set a patient’s target ranges, which display as horizontal blue lines on the graph.
Steps
| 1. | Open the Anticoagulation Summary Sheet using one of the following methods: |
If you are a provider reviewing your un-reviewed investigation results, in the Investigations/Document In Basket window, double-click an INR result. See Reviewing electronic investigation results and reports.
If you have a patient chart or visit note open, right-click and then, in the SMART menu, choose View INR Summary.
If you manage all your INR results at once from an INR daily report, run the report. From the report, open a patient’s medical summary, right-click and then, in the SMART menu, choose View INR Summary. See Managing INR results from a daily report (via practice search).
The patient’s Anticoagulation Summary Sheet window opens.
| 2. | To view a list of the current and historical INR results, click the Text tab. The EMR displays the following information: |
Previous Directions: most recent anticoagulation medication instructions given to the patient
Current and historic INR results
Anticoagulation medication dose and frequency at the time of each INR result
INR follow-up instructions for each INR result
Anticoagulation medication adjustment instruction for each INR result
Tip: A patient’s most recent INR and corresponding anticoagulation medication dosage displays at the top of the table in blue.
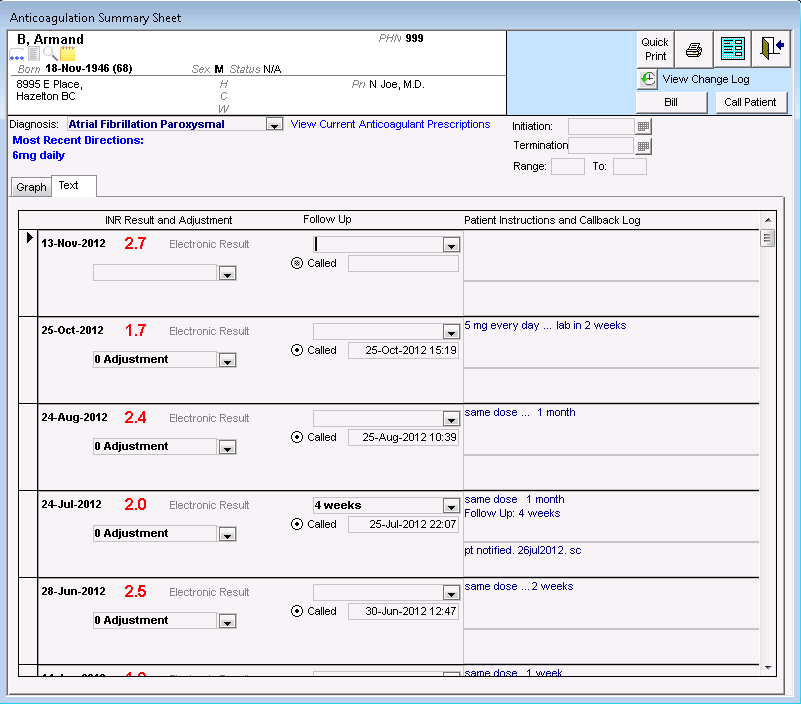
Note: If a patient has not received an INR result, the table appears blank.
| 3. | To view the patient’s latest anticoagulation medication prescription, click View Current Anticoagulant Prescriptions. The patient’s current and historic anticoagulation prescriptions are displayed. |
| 4. | To view a graph of the current and historic INR results, click the Graph tab. |
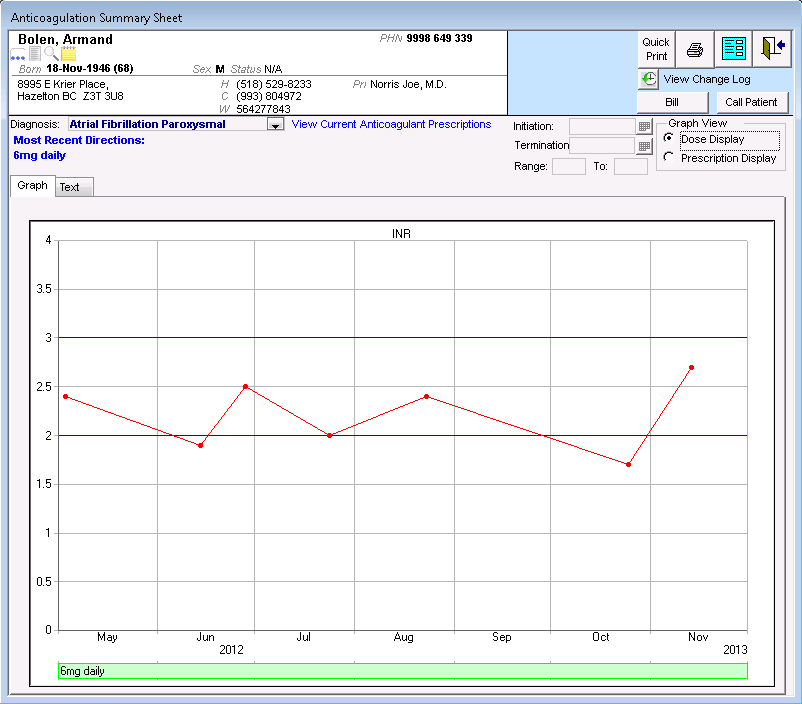
To view the patient’s anticoagulation medication dose details on the graph (recommended view), click Dose Display. The patient’s anticoagulation medication details display at the bottom of the graph.
Anticoagulation dosage information, originates from the dosage instructions (INR Result Adjustment column) in the Text tab of the Anticoagulation Summary Sheet window. See Modifying a patient’s INR test and anticoagulation medication instructions.
To view medication changes based on the patient’s prescriptions at the bottom of the graph, click Prescription Display. This view does not reflect changes made in the Text tab of the Anticoagulation Summary Sheet.
To add the patient’s INR targets to the graph, in the Range fields at the top of the window, enter the “normal” or “goal” INR minimum and maximum value. The targets display as horizontal blue lines.
To view an exact INR value and date for a specific data point on the graph, hover your cursor over a data point.
| 5. | When you are done, click Save & Close |
© 2018 ![]()