Graphing vitals
You can view patient growth charts and vitals over time in a graph as well as changes to the patient’s medications in the same time line.
See also Graphing investigation results.
Steps
| 1. | Perform one of the following actions: |
From any window related to the patient’s medical record (for example, a SOAP note), right-click and then, in the SMART menu, click View Clinical Graphs.
To graph blood pressure, right-click and choose View Blood Pressure Graph.
To graph the BMI, right-click and choose View Growth Charts > BMI.
For patients aged 2-20, click Show 2-20yr to view the BMI growth charts vs age in the same chart.
To graph vitals, head circumference, height, weight, or growth charts, from within a SOAP note, beside the value you want to graph, click ![]() .
.
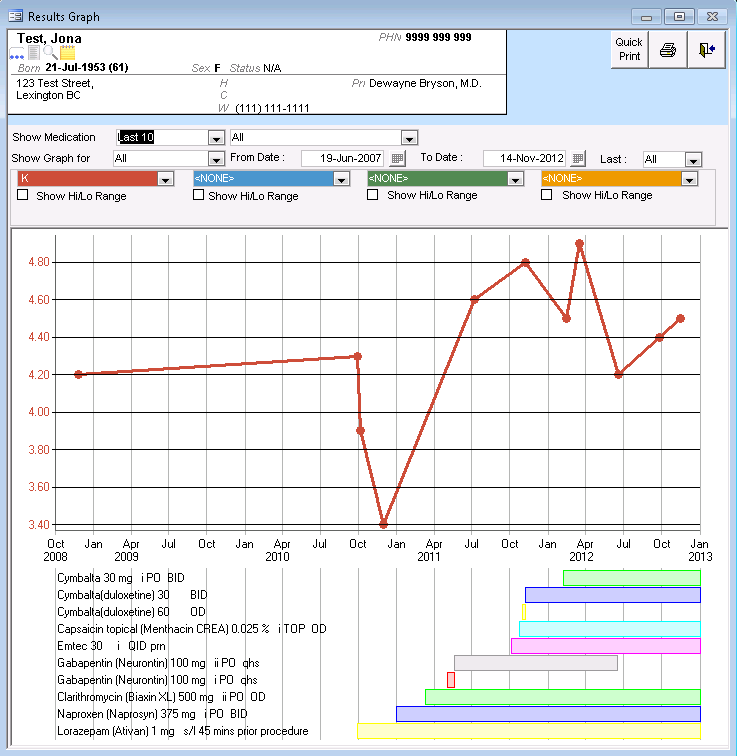
The Results Graph window opens.
| 2. | In the first (red) list on the left, select the value you want to graph (if the value is not graphed already). |
| 3. | To narrow the number or date-range of the graphed value(s), perform one of the following actions: |
To narrow the date-range to 3 years, 1 year, 3 months, or 1 month, in the Show Graph for drop-down list click a time option. The EMR graphs investigations occurring within the period selected.
To display only values for a certain date range, in the From Date field, enter the start date and then, in the To Date field, enter a end date.
To display a specific number of data points, in the Last list, click the number of data points you want to see.
| 4. | To display the exact result, hover your mouse over a value. |
| 5. | To superimpose the patient’s medication history on the graphed values: |
| a) | In the Show Medication list, select the number of medications you want to display. |
| b) | In the drop-down list to the right of Show Medications, perform one of the following actions: |
To display all the medications on the graph, click All.
To display only one medication on the graph, click the medication.
| 6. | To also graph the patient’s vitals, labs and other investigations, in the blue, green, and yellow drop-down lists, select the values to graph. |
| 7. | To print the graph, at the top of the window, select one of the following options: |
Quick Print ![]() : The EMR sends the print job to your default printer to be printed.
: The EMR sends the print job to your default printer to be printed.
Print ![]() : The EMR prompts you to select a printer to print to.
: The EMR prompts you to select a printer to print to.
© 2018 ![]()