Graphing investigation results
If a lab or investigation result is numeric, you can easily produce a graph to see changes over time as well as changes to the patient’s medications in the same time line.
Manually entered investigation results cannot be graphed.
Users with administrator authority can make manual results “graphable” by converting them to electronic investigations in the Investigation Maintenance window (Configuration > View > Patient Data Codes > Investigations).
Steps
| 1. | Perform one of the following actions: |
From the Investigation/Document In Basket window, click the investigation result you want to graph.
From the Investigations tab of the patient’s medical summary, click the investigation to graph, and then click Graph ![]() in the top left of the Investigations tab.
in the top left of the Investigations tab.
From any window related to the patient’s medical record (for example, a SOAP note), right-click and then, in the SMART menu, click View Clinical Graphs.
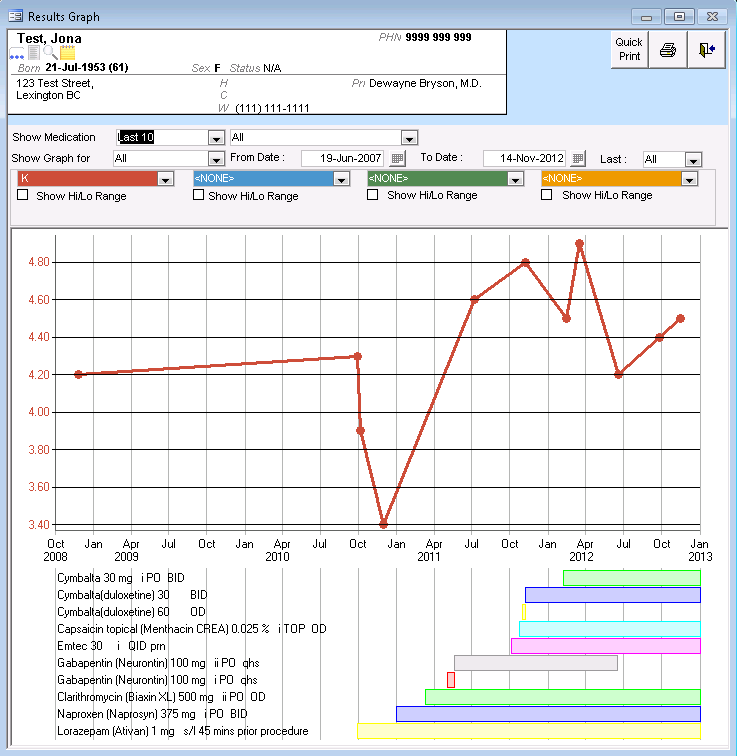
The Results Graph window opens.
| 2. | In the first (red) list on the left, select the value you want to graph (if the value is not graphed already). |
| 3. | To narrow the number or date-range of the graphed value(s), perform one of the following actions: |
To narrow the date-range to 3 years, 1 year, 3 months, or 1 month, in the Show Graph for drop-down list click a time option. The EMR graphs investigations occurring within the period selected.
To display only values for a certain date range, in the From Date field, enter the start date and then, in the To Date field, enter a end date.
To display a specific number of data points, in the Last list, click the number of data points you want to see.
| 4. | To display the exact result, hover your mouse over a value. |
| 5. | To superimpose the patient’s medication history on the graphed values: |
| a) | In the Show Medication list, select the number of medications you want to display. |
| b) | In the drop-down list to the right of Show Medications, perform one of the following actions: |
To display all the medications on the graph, click All.
To display only one medication on the graph, click the medication.
| 6. | To also graph the patient’s vitals, labs and other investigations, in the blue, green, and yellow drop-down lists, select the values to graph. |
| 7. | To print the graph, at the top of the window, select one of the following options: |
Quick Print ![]() : The EMR sends the print job to your default printer to be printed.
: The EMR sends the print job to your default printer to be printed.
Print ![]() : The EMR prompts you to select a printer to print to.
: The EMR prompts you to select a printer to print to.
© 2018 ![]()